Source: The Guardian
A Clinton-Trump face-off in November looks more likely than ever. With both candidates having high disapproval ratings, victory may go to the least disliked
After Tuesday’s Indiana primary, it seems inevitable that in the presidential election in November, Americans will choose between Donald Trump and Hillary Clinton.
Head-to-head polls have nearly all shown Hillary Clinton beating Donald Trump. Currently her lead is at 6.5 percentage points but the gap has and will continue to change. Photograph: DSK/AFP/Getty Images
It wasn’t always this way. Last summer, Trump was dismissed by some experts as “not a real candidate”, with a 2% chance of winning his party’s nomination. And although Clinton has been the Democratic frontrunner since announcing her bid in April 2015, that a former first lady is running at all is still no small surprise.
The question now looming is which candidate can make it all the way to the White House.
Making predictions about November in May may be asking for trouble, but by some metrics it looks like Trump’s luck may have run out. When polls have asked voters to imagine a scenario in which they must choose between Trump and Clinton, most have said they would choose Clinton.
Since May last year, 67 polls have pitted the two candidates against one another. In 58 such polls, respondents chose Clinton over Trump. Three polls found the two candidates tied and six gave Trump the win – on average by less than four percentage points.
General election: Clinton (blue) vs. Trump (red)
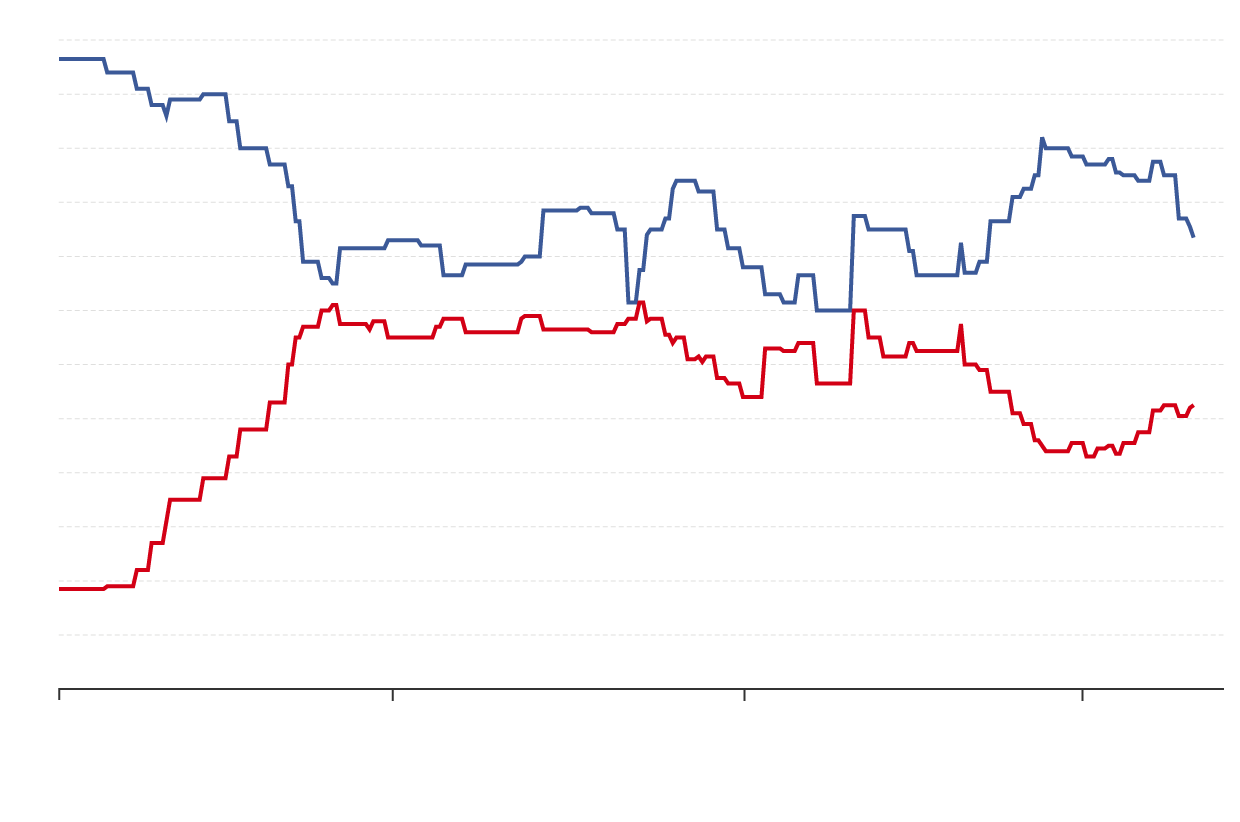
However, polling averages show the gap changing considerably. In July 2015 it was vast (Clinton by 20 percentage points); in January 2016 it was small (Clinton by three). Currently, there are 6.5 percentage points between the two. That gap will no doubt continue to change.
Imagining who will lose the 8 November election is sometimes harder than imagining who will win. The primary season can warp perceptions.
Candidates have a string of wins under their belts by the time they secure the nominations – in this case, Trump has won 28 states and Clinton 25. But those wins may not seem quite so glorious when you attempt to distinguish the popularity of winning candidates from the unpopularity of their rivals.
Since June 2015, for example, more Americans have said they have an unfavourable opinion of Trump (on average 60%) than a favourable opinion (35%).
Trump’s unpopularity has been pretty consistent. Often, when he appears to catch Clinton in national polling, it’s not so much about a Trump surge as a Clinton dip. And since November, similar polling for the former secretary of state has found that respondents are less inclined to say they have a favourable opinion of her.
Percent who view candidate as unfavourable Clinton (blue) vs. Trump (red)
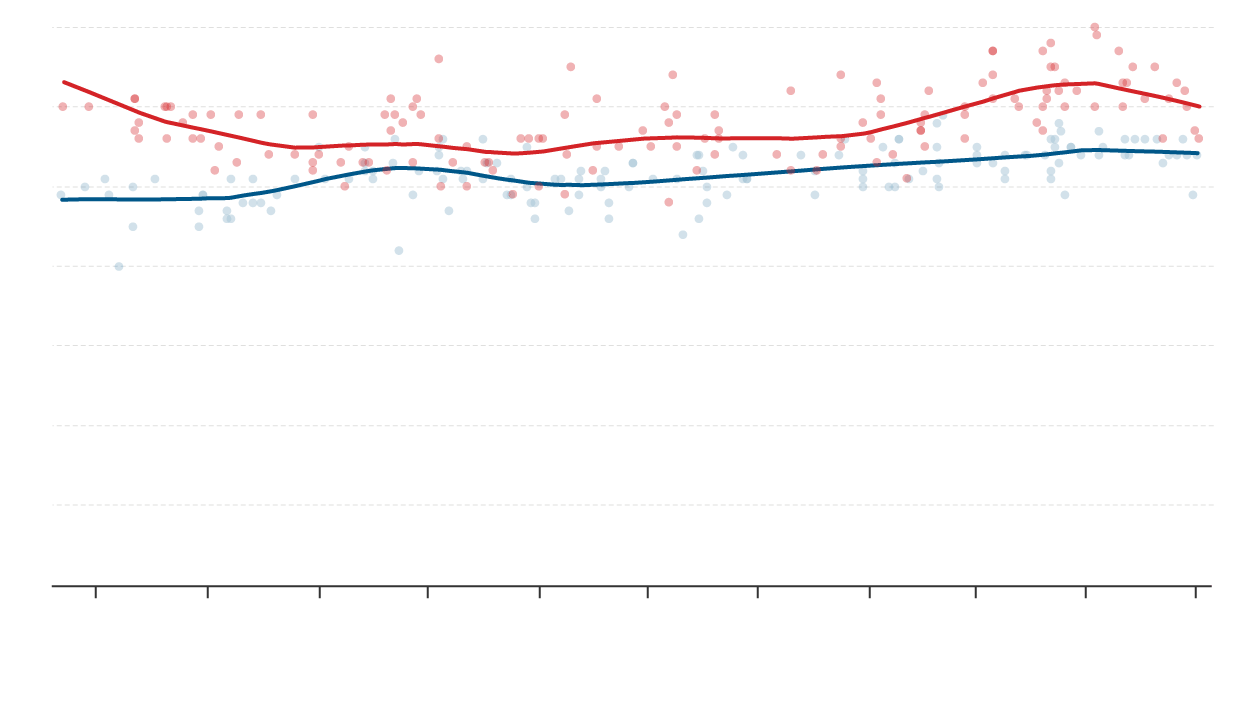
Clinton’s falling popularity has been so steady that last month she was considered more unfavourable than favourable – just like Trump.
That conclusion – that neither of the two candidates Americans will probably have to choose between are viewed favourably by the majority of those Americans – is important. It could affect turnout, especially if there is a particular lack of enthusiasm in one party.
Turnout at primaries has been high – almost double that of 2012, according to Pew Research Center. Among Republicans, primary turnout has risen from 9.8% in 2012 to approximately 17.3%. Democratic turnout has increased from 6.3% to 11.7%, although four years ago the incumbent Barack Obama did not face a serious challenger. If Trump can convince more people to show up, he could close the gap.
There is another thing Trump will have to do: win over voters who do not identify as Republican. There are a lot of them. The percentage of Americans who describe themselves as independent is at a record high: according to Gallup, which has conducted polls on voter identification since 1988, 42% of respondents say they are independent while 29% say they are Democratic and 26% Republican.
Understanding the demographics of Trump’s and Clinton’s supporters can offer important clues about who they need to attract. A recent poll from CNN/ORC found that individuals who said Trump was their first choice for president were more likely to be male, white or older.
Candidate support by demographic
Who would you most like to see win your party’s nomination for president?*
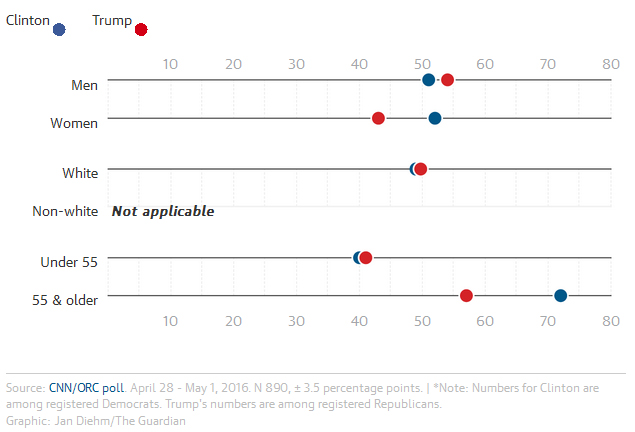
Of those who described themselves as “independent”, 42% said Trump was their first choice. When asked if they were “enthusiastic” about the prospect of Trump being nominee, 32% of independents said they were and 33% said they were “satisfied but not enthusiastic”. The poll has a margin of error of plus or minus 3.5%.
When CNN/ORC conducted the poll, between 28 April and 1 May, they also asked those 1,001 adults (890 of whom were registered voters) about Clinton. Her supporters were more likely to be female, urban or have an income of more than $50,000 a year.
Many such findings about Trump and Clinton supporters have been borne out by exit polling during the primary season.
At this early stage of gazing into the crystal ball, a couple of things seem possible. Clinton will need to continue to appeal to women and older voters – not least because those groups are more likely to cast a ballot on election day.
But the non-white vote will also become a more focused issue. When 31% of the US electorate is not white and there is only a 6% gap between candidates, it’s clear how important such voters could be.
Ultimately, though, there is only one thing Clinton needs to do to win the White House in November: make herself less unpopular than Trump.